Why Looking at CAC Alone Can Mispresent Your Business Performance at Scale

Customer acquisition cost is one of the most reported metrics in boardroom decks. Leadership teams track it monthly, investors benchmark it against sector averages, and growth strategies frequently live or die by whether the number moves up or down. However, the problem is, at scale, CAC as a standalone figure tells you less than it appears to - and the decisions built on it can quietly erode unit economics even while the metric looks healthy.
This is not an argument against measuring CAC. It is an argument for understanding exactly what it measures, what it omits, and where its structural limits emerge as a business grows.
What is the Right Way to Calculate Customer Acquisition Cost (CAC)?
The equation looks precise. In practice, most organizations calculate it with enough variation that comparing CAC figures across teams, time periods, or competitors produces numbers that do not describe the same thing.
The first point of divergence is cost inclusion. Many teams calculate CAC using ad spend alone - a media efficiency number, not a true acquisition cost. A complete CAC calculation includes salaries for sales and marketing headcount, agency fees, marketing technology, event costs, commissions, and content production. When these costs are excluded, the metric understates the real cost of growth.
The second divergence is the treatment of organic and paid channels. Blended CAC divides total acquisition spend by all new customers, including those who arrived through organic search, referral, or brand-driven intent. Paid CAC measures only the customers acquired through paid spend. The gap between these two numbers has widened materially: paid CAC now runs 2.4x to 3.1x blended CAC across most B2B categories, according to 2026 industry benchmarks. A business that reports blended CAC without disaggregating it by channel overstates marketing efficiency. The organic customers were not free - they reflect brand investment, content production, and SEO infrastructure that rarely appear in the denominator.
The third divergence is timing. A sales cycle that spans 60 to 90 days means marketing spend in Q1 drives customer acquisition in Q2. Teams that align spend and acquisition to the same period compress CAC artificially. Teams that stretch the attribution window too far in the other direction inflate it. Neither produces a reliable signal.
What is the Right Way to Calculate Customer Acquisition Cost (CAC)?
.png)
The equation looks precise. In practice, most organizations calculate it with enough variation that comparing CAC figures across teams, time periods, or competitors produces numbers that do not describe the same thing.
The first point of divergence is cost inclusion. Many teams calculate CAC using ad spend alone - a media efficiency number, not a true acquisition cost. A complete CAC calculation includes salaries for sales and marketing headcount, agency fees, marketing technology, event costs, commissions, and content production. When these costs are excluded, the metric understates the real cost of growth.
The second divergence is the treatment of organic and paid channels. Blended CAC divides total acquisition spend by all new customers, including those who arrived through organic search, referral, or brand-driven intent. Paid CAC measures only the customers acquired through paid spend. The gap between these two numbers has widened materially: paid CAC now runs 2.4x to 3.1x blended CAC across most B2B categories, according to 2026 industry benchmarks. A business that reports blended CAC without disaggregating it by channel overstates marketing efficiency. The organic customers were not free — they reflect brand investment, content production, and SEO infrastructure that rarely appear in the denominator.
The third divergence is timing. A sales cycle that spans 60 to 90 days means marketing spend in Q1 drives customer acquisition in Q2. Teams that align spend and acquisition to the same period compress CAC artificially. Teams that stretch the attribution window too far in the other direction inflate it. Neither produces a reliable signal.
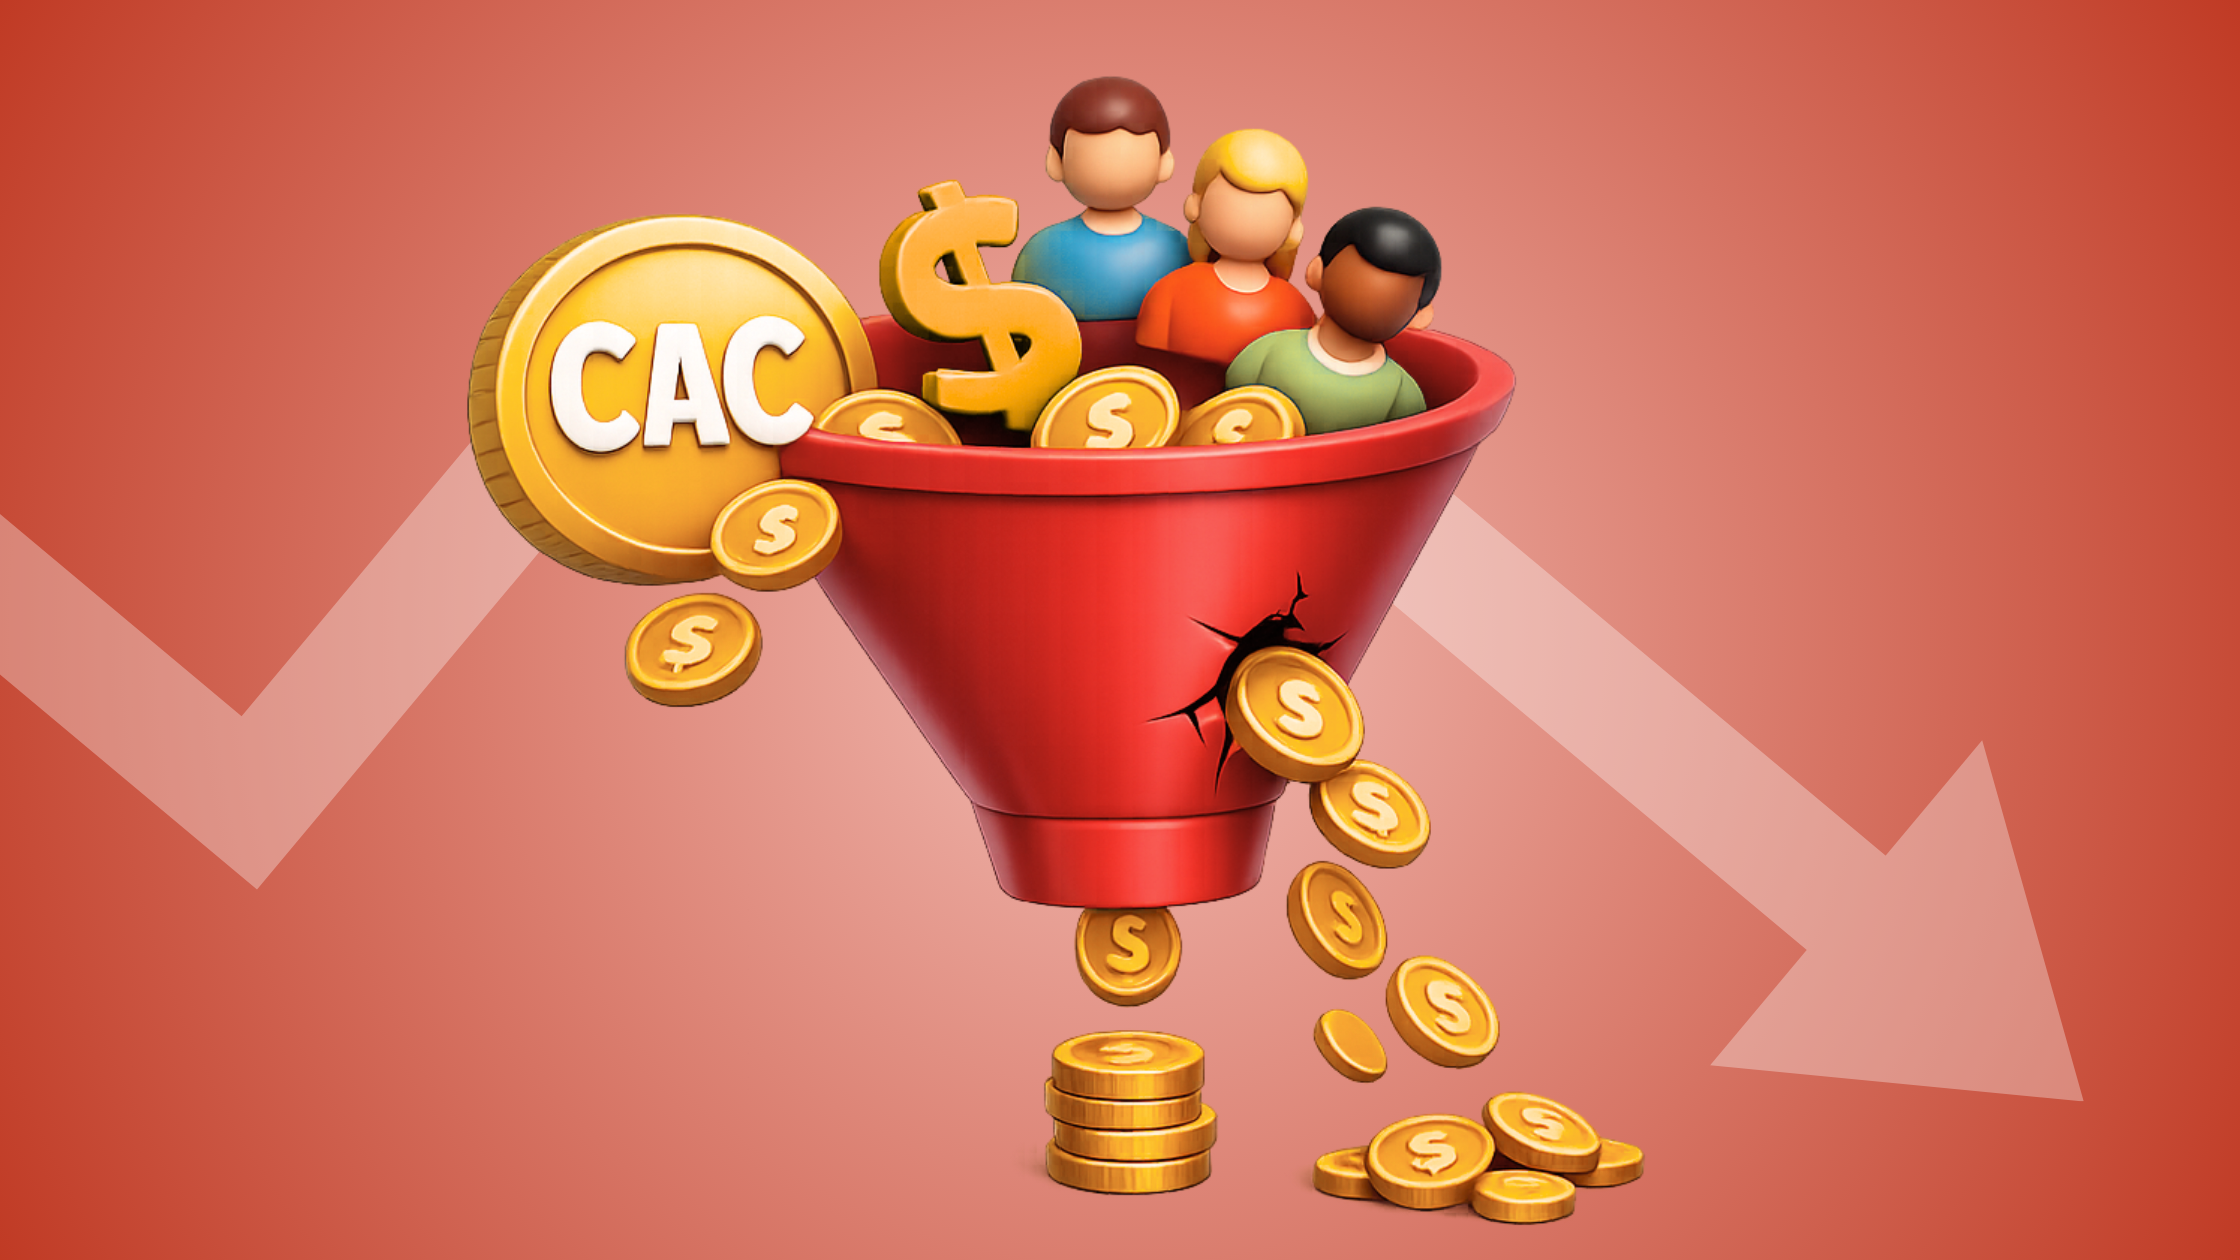
What Blended Customer Acquisition Cost (CAC) Hides at Scale
As a business grows, the ratio of new-to-brand customers versus returning brand-familiar customers shifts. A scaled business develops a larger base of customers who re-engage through direct, organic, and referral channels - all of which carry lower acquisition costs than net-new paid acquisition. These lower-cost conversions pull the blended CAC down. The metric improves. But the underlying efficiency of acquiring genuinely new customers may be deteriorating at the same time.
This is precisely why new customer CAC (nCAC) - which isolates the cost of acquiring customers who have no prior relationship with the brand - serves as a more accurate indicator of whether a business can sustain growth beyond its existing base. Companies with strong retention strategies regularly show lower blended CAC due to repeat customers, which makes cross-company benchmarking using blended CAC an exercise in comparing unlike things.
The practical consequence: a growth team that optimizes toward a blended CAC target may, over time, shift spend toward re-engagement and retention channels, improve the reported number, and simultaneously reduce investment in the top-of-funnel activity that generates genuinely new demand. The dashboard looks better. The pipeline narrows.
Why Customer Acquisition Costs Increase Over Time
Digital advertising costs have climbed steadily across every major platform. According to WordStream's analysis of over 16,000 campaigns, the average cost per click on Google Search has risen from $2.32 in 2016 to $5.42 in 2026 - a 133% increase over a decade. CPC increased for 86% of industries between 2023 and 2024 alone, with an average rise of 10% in a single year.
What does this mean for CAC? The cost of acquiring customers through paid intent-based channels has grown significantly faster than most businesses' revenue per customer. When a blended CAC figure holds steady or improves against this backdrop, it frequently signals a shift in acquisition mix - more organic, more brand-familiar, more retention-driven - rather than genuine efficiency improvement in paid channels. Without channel-level disaggregation, these two very different situations look identical on a standard CAC dashboard.
McKinsey's research on brand-driven growth reinforces this dynamic: when brand equity is strong enough from upper-funnel investment, businesses can reduce dependence on transaction-promoting paid spend because customers arrive with higher intent and lower cost. The inverse is also documented - even the strongest performance marketing cannot compensate for weakness in the brand factors that determine purchasing decisions. CAC alone cannot surface either of these dynamics.
Why CAC Alone Cannot Measure Revenue Growth Efficiency
The most significant limitation of CAC as a growth metric becomes visible when a business reaches the stage where existing customers generate a meaningful share of new revenue through upsells, cross-sells, and contract expansion.
McKinsey research on B2B growth shows that retaining a customer cost less than a third of acquiring one, and that existing customers generate on average 10% more revenue than new ones. Separately, McKinsey's work with growth-stage companies found that 80% of the value creation achieved by the world's most successful growth companies comes from their core business - principally, unlocking new revenue from existing customers. Companies that concentrate disproportionately on new customer acquisition while underinvesting in customer success and expansion motion pay a multiple of the cost for a fraction of the return.
The structural problem: CAC is designed to measure new customer acquisition. It has no mechanism to capture or reflect the economics of expansion revenue. A business that generates $2 of new ARR from existing customers for every $1 spent on customer success has a materially better unit economics profile than its CAC figure suggests - but the metric doesn't show it.
Net revenue retention (NRR) captures this dynamic in a way CAC cannot. An NRR above 100% means the existing customer base generates more revenue year over year, independent of new acquisition activity. Businesses that track CAC without tracking NRR alongside it measure the cost of filling a bucket without accounting for how much the bucket retains.
Which Metrics Should Be Tracked Alongside Customer Acquisition Cost (CAC)?
None of this suggests abandoning CAC. It suggests embedding it within a measurement framework that accounts for the structural limitations outlined above.
Three additions make the metric more decision-useful at scale:
Channel-level CAC disaggregation. Report paid CAC and blended CAC separately, and track CAC by channel so that budget allocation decisions reflect where spend actually generates efficient new customers rather than where it recycles existing intent.
nCAC alongside blended CAC. Track new customer acquisition cost independently from overall acquisition cost. As the business scales and brand equity accumulates, blended CAC will naturally compress. nCAC reveals whether the acquisition engine can reach new audiences or whether growth is increasingly dependent on harvesting existing brand equity.
LTV:CAC ratio and CAC payback period. The LTV:CAC ratio of 3:1 remains the standard benchmark for sustainable unit economics = meaning every dollar spent on acquisition returns three dollars in customer lifetime value. Meritech Capital notes that companies need both a strong LTV:CAC ratio (3:1 or above) and a fast payback period (under 12 months) to achieve optimal capital efficiency. These two metrics together determine whether a given CAC is acceptable or unsustainable - a question CAC alone cannot answer.
Why Measuring CAC Correctly Creates a Competitive Advantage
The businesses that treat CAC as a single, composite number tend to optimize for it as such - adjusting spend mix, attribution windows, and cost inclusions to move the figure in the desired direction. The businesses that disaggregate it, track it against LTV and NRR, and hold channel-level performance to separate standards build a more accurate picture of where growth is actually coming from and what it actually costs.
At scale, the difference between these two approaches is not a reporting preference. It is the difference between a growth model that compounds and one that quietly plateaus while the dashboard still shows green.
---
Not sure whether your growth metrics are giving you the full picture? Reach out to us.
Relevant Insights:
· Article: The Hidden Cost of Ignoring Customer Lifetime Value (CLV) in Paid Media
· Guide: A Guide to Marketing Measurement: How Leading Brands Combine MMM, Experiments, and Platform Data
· Article: Why Product Category-Level CLV Matters for Media, Measurement, and Growth?
About Crealytics
Crealytics is an award-winning full-funnel digital marketing agency fueling the profitable growth of over 100 well-known B2C and B2B businesses, including ASOS, The Hut Group, Staples and Urban Outfitters. A global company with an inclusive team of 100+ international employees, we operate from our hubs in Berlin, New York, Chicago, London, and Mumbai.
EXPERT INSIGHTS